
Shift & crew comparisons
Compare readings, exceptions, and completion across shifts, crews, and stations to find where variation starts.
Analytics · Tier 2
Once Live is trusted, LIMIS turns your validated workflow records and approved readings into operational insight. It never touches the control system, and it never runs ahead of validation.
What you actually get
LIMIS Analytics is grounded in the records your team already submitted and reviewed, so every chart traces back to an inspectable source.
Compare readings, exceptions, and completion across shifts, crews, and stations to find where variation starts.
See how a tag, unit, or workflow behaves over weeks and months instead of a single shift snapshot.
Surface recurring out-of-range conditions and the context around them so reliability teams can act on patterns, not one-offs.
Generate daily and periodic operating summaries from validated work records instead of manual spreadsheets.
Track completeness and validation status so you know how much to trust each view.
Early-warning models on validated history, introduced only after a site has a trusted data foundation.
Example outputs
Analytics lives beside the records it summarizes, so a supervisor or leader can drill from a trend straight to the underlying entry.
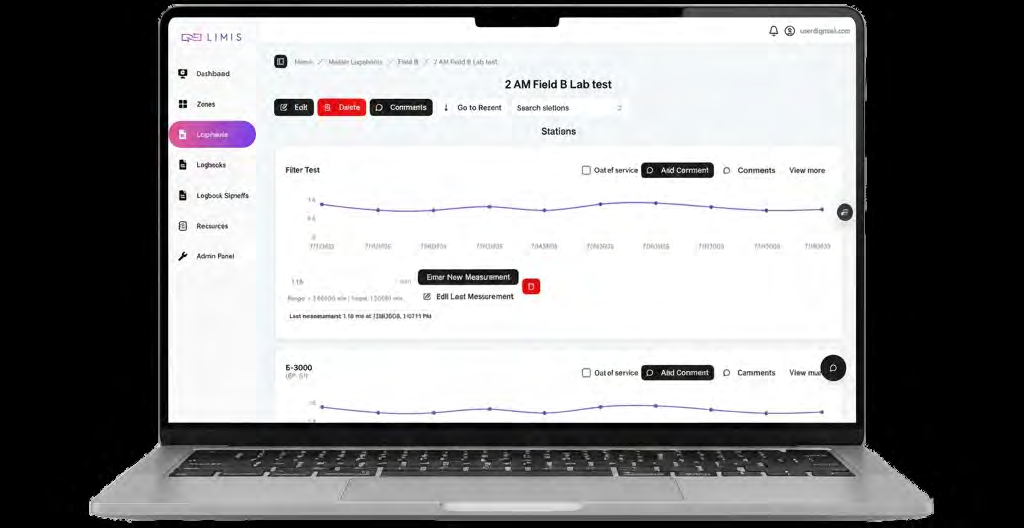
Each data point links back to the validated submission, reviewer, and timestamp behind it.
Designed to be read in a shift or weekly review, not reconstructed from disconnected tools.
Boundaries
Analytics changes nothing about how LIMIS connects to your plant. It only adds depth on data that has already been approved and validated.
No writeback, no control changes, no command pathway. See Governance.
Analytics runs on approved records, never on unreviewed or unvalidated entries.
Your data stays yours, with export available. See Security.
Sequence
Most teams begin with a Live pilot and add Analytics once the data foundation is trusted. We will help you sequence it.